Talking Tech: Take Your Anaplan Reporting to New Heights
Meet the Author
Let’s Talk Tech.
Accordion’s “Talking Tech” series explores how different CFO Technology solutions can empower finance functions to support organizational strategic initiatives – by implementing business process recommendations, optimizing operations, and capitalizing on value creation opportunities.
Now, let’s take a look at Anaplan in the context of reporting capabilities.
If you have been looking for ways to improve your reporting capabilities, then you’re in luck! Recently, Anaplan released a new Management Reporting feature, which allows organizations to create customized reporting packages directly within the tool itself.

What Is Management Reporting?
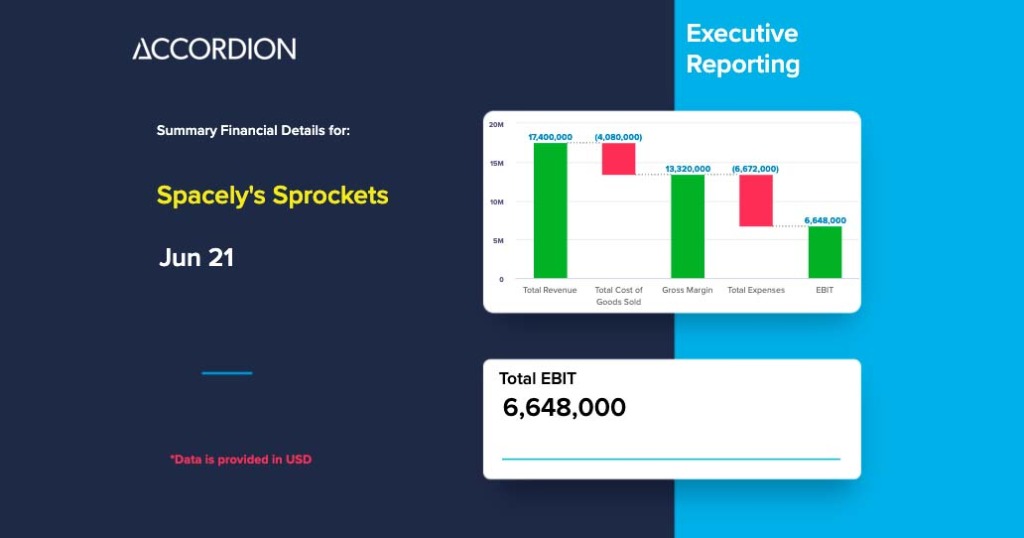
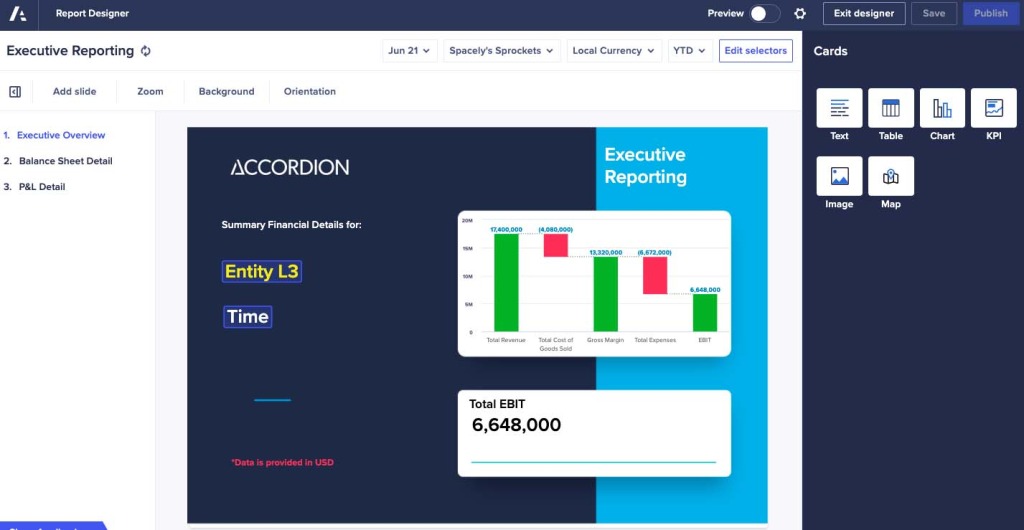
Management Reporting is a whole new way to view and report data within Anaplan. Report pages reside in your Anaplan Apps just like your boards and worksheets, but report pages have a much closer resemblance to slides than your other pages. In fact, a report page can contain multiple slides within a single page, effectively serving as a slide deck that you can present directly in Anaplan or export as a PDF. These slides can house a wide variety of text, graphs, grids, and images, along with customized templates to tailor-fit the reports to your organization.
Do These Reports Update in Real Time Like Other Anaplan Dashboards?
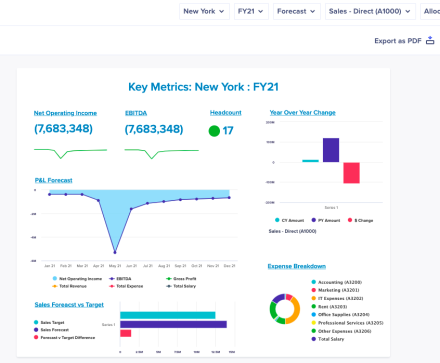
Absolutely! Just like other Anaplan dashboards, data in the grids, charts, and KPIs all update in real time. Also, these report pages can keep Anaplan’s dynamic flexibility as a core feature – if desired, users can have the capability to change report values based on Anaplan lists, allowing them to quickly toggle views between different time periods or teams within your organization. The real-time updates and flexibility of the reports will also allow organizations to spend less time on recreating templates and reports again and again, giving teams more time back to spend on other activities.

How Do I Get Started?
Getting started is easy! In fact, if you have Page Builder access in your workspace, you can get started today. Creating a report is done the same way as creating any other page within an App – you will just need to choose the “Report” option when selecting a specific type of page to create. Building the components of a report feels very similar to building other pages, utilizing the same types of card options. The real difference comes with the card placement: on report pages, you can place cards like grids and charts anywhere that you’d like (you can even stack them on top of each other), as opposed to the more rigid card placement on board pages. For even more details on how to build reports, please visit Anaplan’s overview on report pages.

If you want to determine how your organization can more effectively leverage reporting in Anaplan, then let’s talk!

